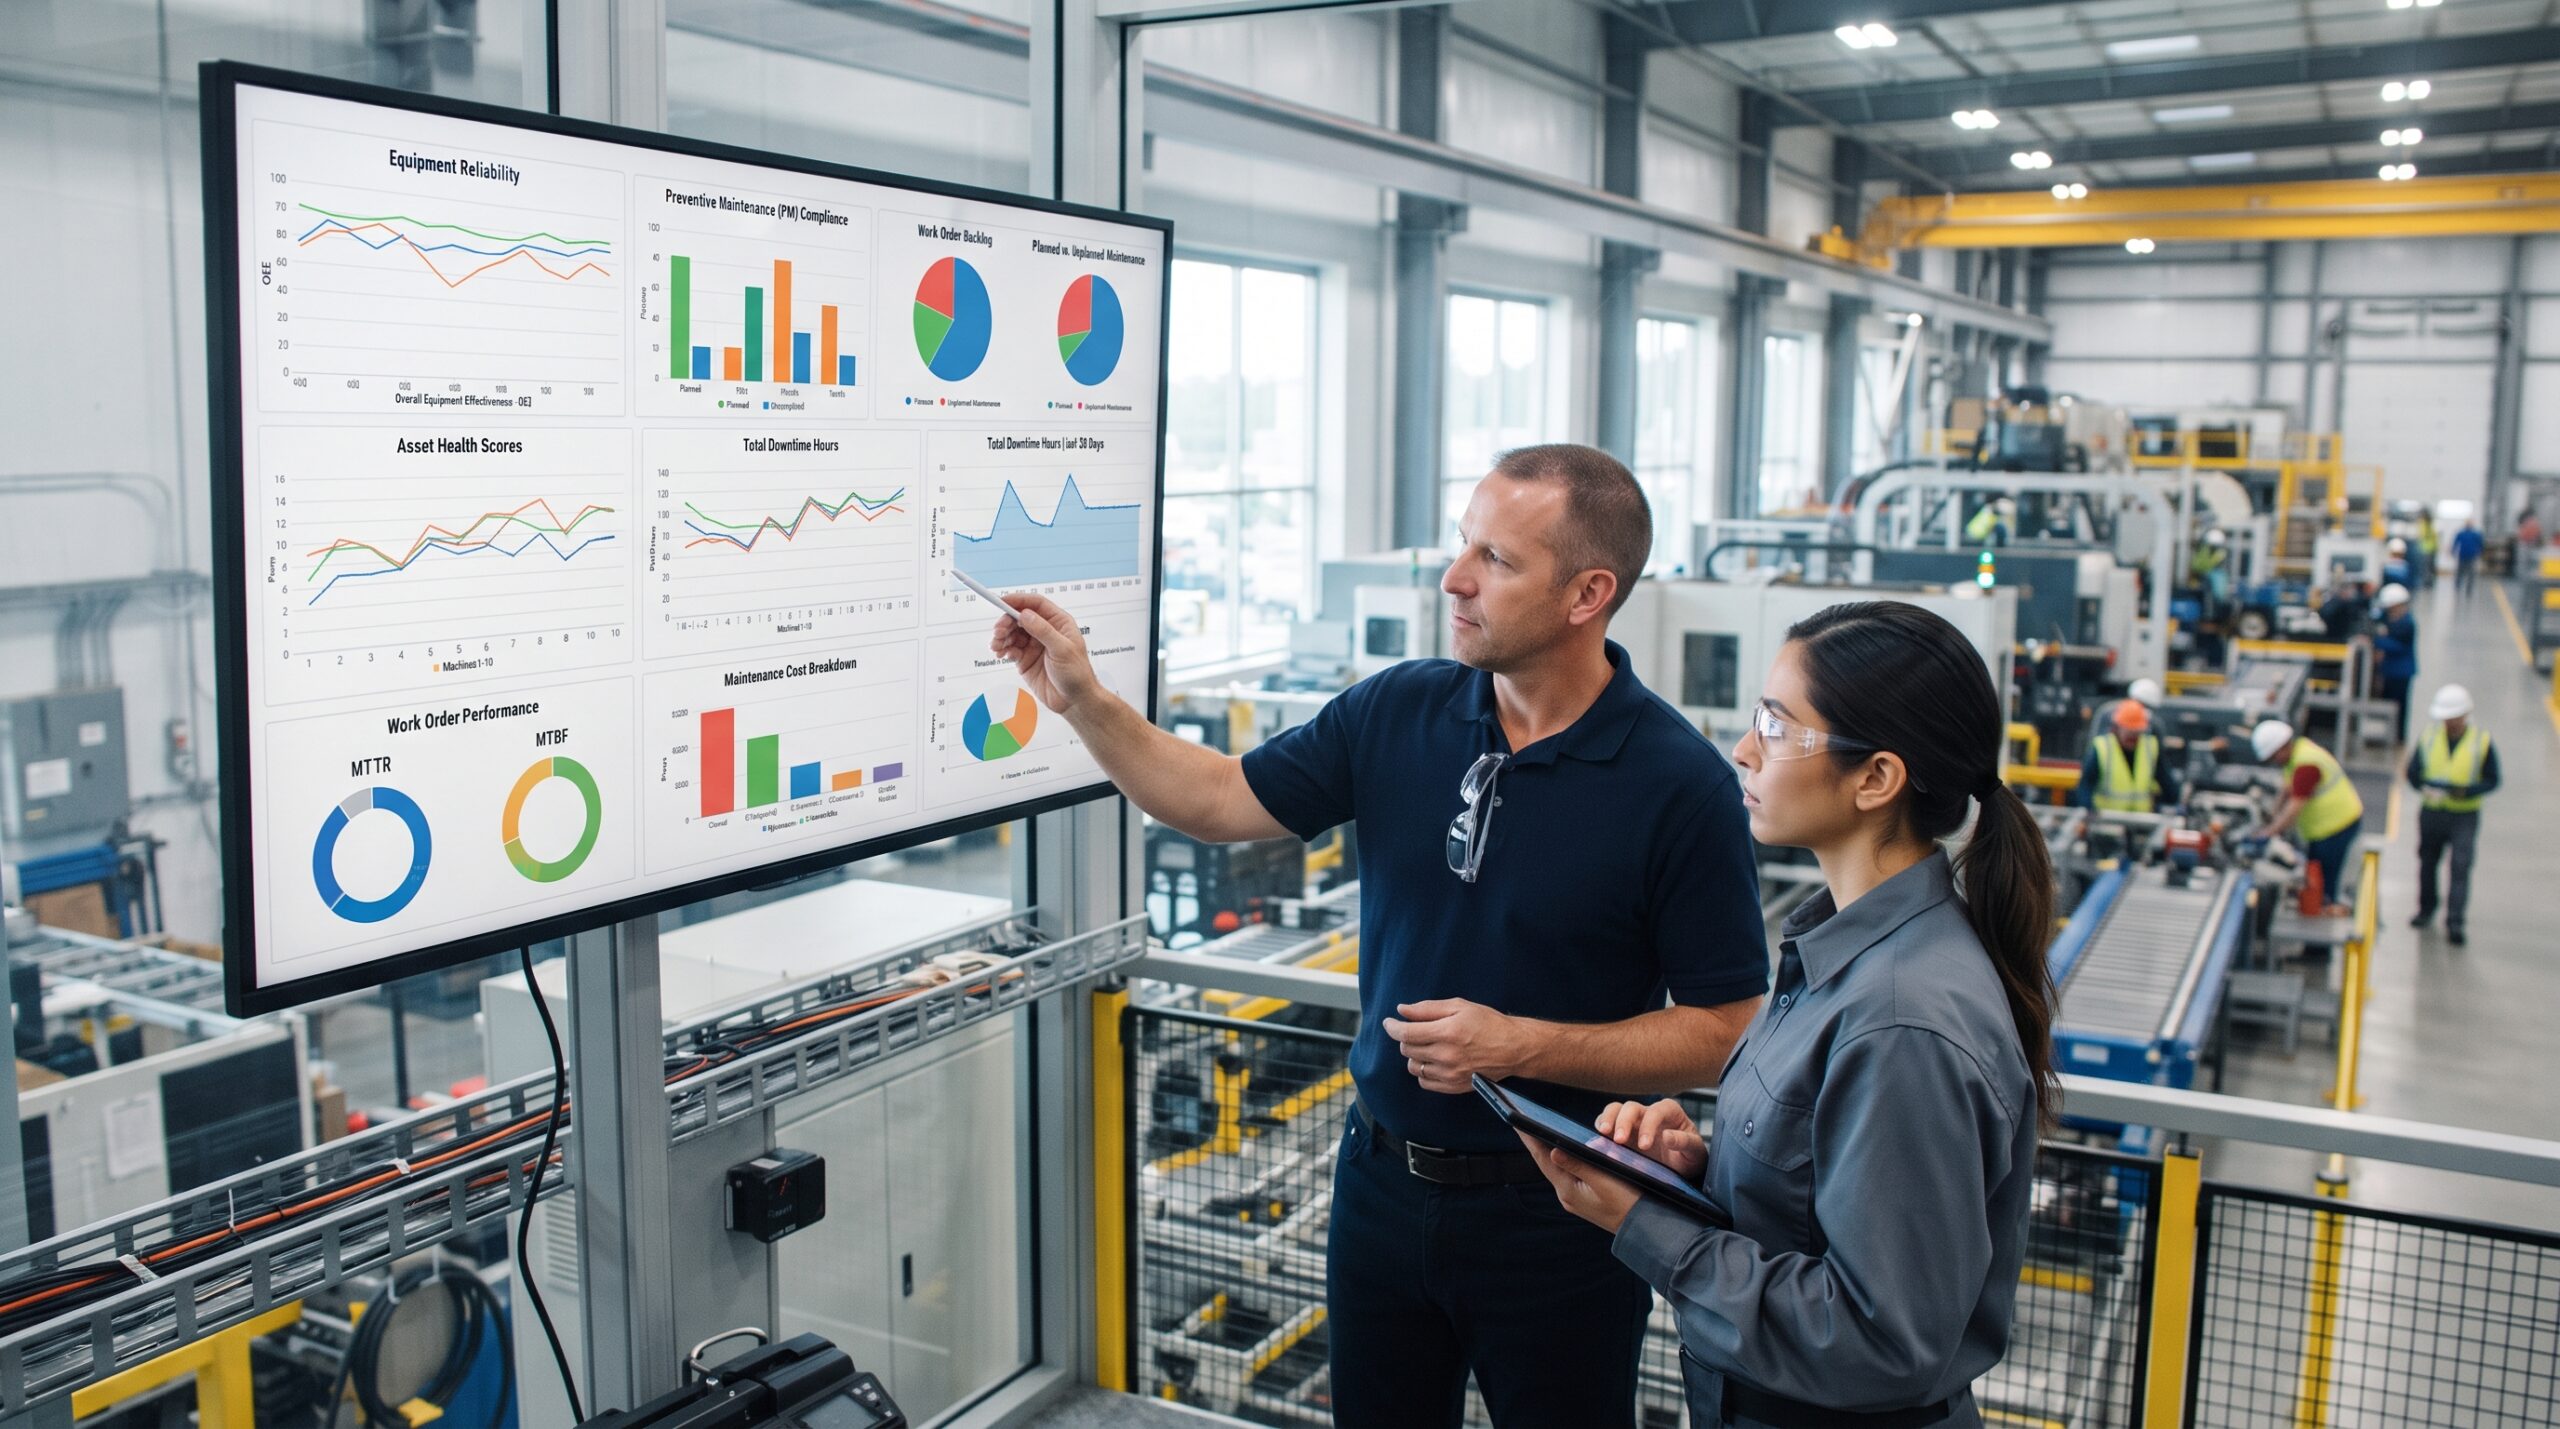
Ask most maintenance managers what they track, and you’ll hear the same two answers. MTTR and MTBF. Solid CMMS KPIs maintenance teams actually use go a lot further than that, though. Those two numbers aren’t wrong. They’re just not the whole picture. A team can post a great MTTR while technicians are quietly slapping quick fixes on things instead of solving the real problem. And a good MTBF this quarter might just mean you got lucky, not that anything actually improved. The metrics that change real decisions, budget approvals, staffing calls, equipment replacement, sit one layer past these two.
The Blind Spot Behind MTTR and MTBF
A surprisingly low MTTR isn’t always a good thing. In some cases, it means technicians are making a quick temporary repair rather than taking the time to address what’s actually causing the failure. That’s why MTTR should be viewed alongside first-time fix rate and rework. If repairs are happening quickly but the first-time fix rate is low and rework is high, the numbers are hiding a bigger problem. The financial impact of getting this wrong is significant. Unscheduled downtime costs the world’s 500 largest companies nearly 11% of annual revenue, which adds up to roughly $1.4 trillion globally. That puts into perspective why looking at only one maintenance metric can give leadership the wrong impression.
What OEE Catches That the Old Two Numbers Miss
OEE looks at three areas at once: equipment availability, operating performance, and product quality. That’s why it’s one of the stronger maintenance performance metrics for seeing what’s really happening across an operation. A world-class OEE is around 85%, but the average plant is often closer to 60%. Moving the number up by just five points can potentially free up enough production capacity to equal another full shift, without adding new equipment. For leadership, that’s a much easier benefit to understand because it ties maintenance to production results.
A Better Way to Predict Trouble
When you’re looking for practical MTTR/MTBF alternatives that can point to trouble before a breakdown happens, planned maintenance percentage is a strong place to begin. A PMP above 85% is a commonly used benchmark. Unlike MTTR, it answers a different and important question: is the maintenance team staying ahead of the schedule, or constantly falling behind it? Wrench time is another important measure. It looks at the time technicians actually spend working on the repair, rather than time lost searching for parts or waiting for approvals. Teams that focus heavily on improving MTBF without addressing poor wrench time can end up solving the wrong problem.
The Numbers Nobody Puts on the Executive Report
Some asset management KPIs don’t get the attention they deserve. First-time fix rate helps show whether a repair truly solved the problem or whether the same equipment comes back with the same issue a few weeks later. Backlog ratio compares outstanding work with the number of hours the team can realistically handle each week, which can help show whether staffing is the problem or the team is simply facing a temporary increase in workload. MTTR may be more familiar, but these two measures can reveal developing problems much earlier.
Letting Money Tell Part of the Story
Reliability metrics only tell part of the story. Looking at maintenance spending as a percentage of an asset’s replacement value gives you a better sense of whether you’re spending an appropriate amount to keep that equipment running. It also provides more context than simply comparing this year’s budget with last year’s. Finance teams can understand the measure without needing much explanation, which makes it useful beyond the maintenance department.
Configuring KPI Dashboards in Azzier
Trying to manage a dozen different metrics across multiple spreadsheets can get messy very quickly, often within just a few weeks. Azzier supports configuring KPI dashboards through its application design tools, allowing teams to create dashboards around the KPIs that actually matter to their operation. Once they’re set up, the metrics can be tracked and benchmarked automatically instead of having someone manually pull numbers into Excel every Friday and worry about leaving something out.
Why the Work Never Really Stops
This is an ongoing process, not a project you finish and forget about. Performance monitoring and continuous improvement mean reviewing KPI targets from time to time and changing them when the operation changes. A benchmark that fit your needs two years ago may no longer be realistic for your current equipment or staffing situation. A dashboard can become just as outdated when it’s left untouched. Regularly checking and updating the metrics keeps the information useful and trustworthy.
Where Prediction Comes In
The next step isn’t just collecting more numbers. It’s using those numbers to see what’s likely to happen next. Predictive analytics and maintenance metrics become much more useful when historical failure data is analyzed for patterns instead of simply being stored as a record of what already happened. Azzier’s data analytics tools can help identify repeated problems with a specific asset before they result in another work order. That changes the role of metrics like MTBF from a simple performance measure into something that can provide an early warning.
What Good Looks Like Right Now
The definition of good maintenance performance changes over time, just like expectations in any other field. Maintenance benchmarking 2026 places greater emphasis on OEE, PM compliance, and wrench time as the main indicators, while MTTR and MTBF serve as useful supporting metrics. Looking at all of these together helps teams recognize warning signs earlier instead of waiting for a single lagging measure to confirm that something has gone wrong.
Tying It Into a Real Long-Term Plan
Looking at one maintenance number at a time can only tell you so much. Building a long-term maintenance strategy requires a broader view, with a small group of leading and lagging indicators that are tracked consistently. Over time, those numbers can help shape decisions about staffing levels, budget priorities, and when an asset should be replaced. That way, decisions are backed by actual trends instead of gut feeling.
Conclusion
MTTR and MTBF are still important maintenance metrics, and there’s no reason to leave them behind. They become much more useful when they’re considered alongside other measures. Teams that are performing well typically look at MTTR and MTBF together with OEE, PM compliance, wrench time, and cost data, then review everything on a consistent schedule. Keeping that routine in place makes it easier to notice warning signs early. That’s what helps a maintenance team move from constantly responding to failures to taking action before those failures happen.
Move Your Dashboards Past MTTR and MTBF
Azzier has spent more than 45 years helping maintenance teams move past basic reporting into KPI programs that actually drive decisions, working with government agencies, utilities, and manufacturers across the U.S. and Canada. If your dashboards still stop at MTTR and MTBF, contact us, and we’ll show you what a fuller KPI setup could look like for your team.
Frequently Asked Question
Is there any reason to keep tracking MTTR and MTBF?
Yes. They’re still helpful for understanding equipment and repair performance, but they don’t provide enough information on their own. Pair them with OEE, PM compliance, and first-time fix rate to get a more useful overall view.
What OEE should we aim for in 2026?
An OEE of about 85% is considered world-class, whereas many plants operate closer to 60%. A more useful goal is to improve consistently from where you are today rather than trying to reach 85% all at once.
What is wrench time, and why does it matter so much?
It’s the actual hands-on repair time a technician logs, not time spent tracking down parts or waiting for approval. A poor MTTR is often a wrench time problem, not an equipment problem.
Can a CMMS track all of these metrics on its own?
Yes. A properly set up CMMS pulls these numbers straight from work order and PM data, which beats manual spreadsheet tracking every time.